How our Recycling Plant solution can have a significant impact on the bottom-line.
The solution.
To tackle the challenge of finding energy efficiency opportunities, we created a real-time Recycling Plant solution on our Rayven Platform, that integrates all relevant data sources and enables the business to monitor, predict and optimise energy use.
We began by monitoring energy consumption at the line level, installing wireless meters at the machine switchboards. We also wanted to relate this to the amount of product processed, so we also extracted a serial output from a load cell at the end of each line.
Through doing this we not only found opportunities to reduce energy consumption, but we were also able to relate our experience in food and beverage manufacturing and demonstrate that there were large overages (‘giveaways’) in almost every bag of recycled nurdles. Additionally, there were also line stoppages, which occurred when operators allowed bags to overfill and block the output silo, that were having a significant impact on downtime that could and should be addressed.
Defining what data to collect is critical.
We began by identifying the key metrics required to achieve the desired business outcomes. In this solution, these included:
- Energy consumption at a machine level
- Energy tariffs
- Recycling throughput data
- Continuous and final weight of each bag
- Number of bags filled per hour, per day
Initial goals of the solution.
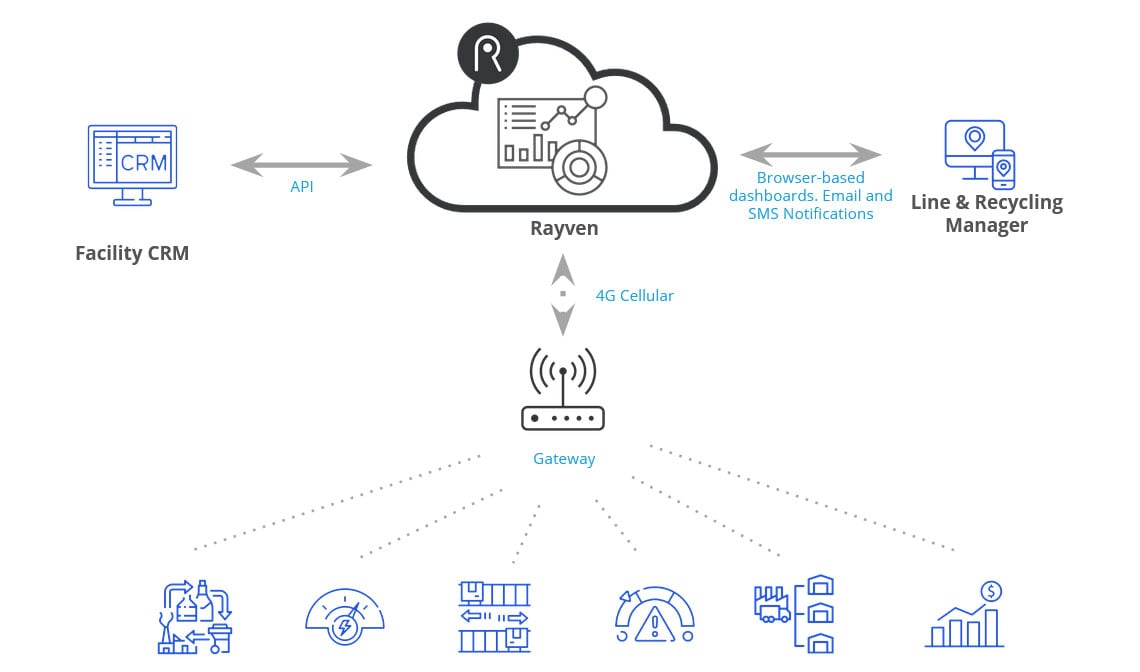
The first goals of the project were to connect to the load cell using an RS232-WiFi module, and collect energy data using a wireless energy meter. That data would be sent in real-time using a 4G gateway to the Rayven Cloud to provide the ability to:
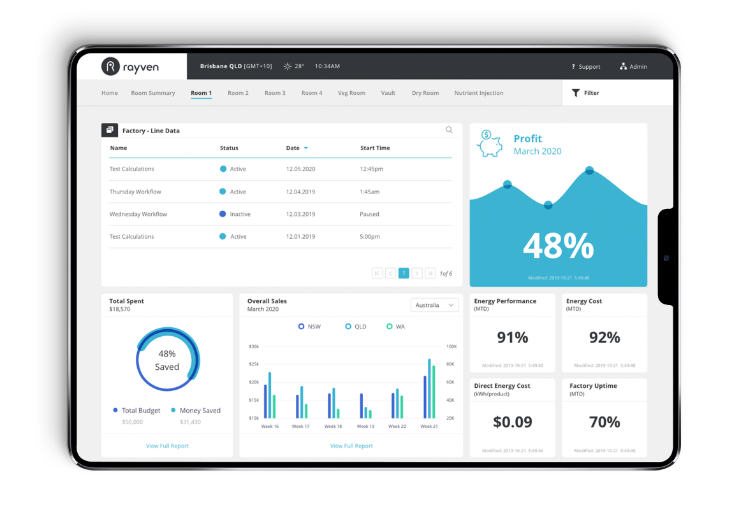
- Monitor the throughput, weight and energy consumption data that’s being received from the equipment via a web-based and mobile system
- Enable device management monitoring for the RS232 and energy meter
- Define business logic in order to visualize key business insights
- Provide notifications via email or SMS when there was machine downtime or when throughput was below the hourly target
- Collect data to compare performance between different lines, machines and feedstocks
- Provide a real-time throughput and waste metric on the mobile phones of management and line managers
- Connect with the ERP system to collect daily targets and upload bag weight, which was previously being manually entered
- Leverage Machine Learning and GenAI to train and identify optimisations via the Rayven Platform
- Test the application, making sure all of the above goals are met, based on the below solution architecture
Before setting the solution live, we tested four critical aspects of the solution:
Security.
The Rayven Platform is built with security as a top priority and our proprietary security architecture ensures that data is secure at all points of the environment.
The solution includes data encryption in transit from device-to-cloud, as well as device authentication; security (Bearer) tokens; SSL, AES and RSA encryption; as well as additional device security checks done via automated polling.
Connectivity.
The first data-point we set out to connect was the load cell, which was achieved using a RS232-Wi-Fi module. In addition, we connected to the machines the energy meter via their 4G gateway, before connecting to the customers ERP system so that we could get the weekly planned processing information, (which was integrated to Rayven via a pull API on a hourly basis).
Data integrity.
As the solution is only as good and reliable as the data you collect, making sure we were getting continuous, reliable connectivity would mean that the data the solution is receiving is always up-to-date and reliable – essential if you are to rely on it to make business decisions in real-time. With that, it was critical for us to test that the data we were seeing on the factory floor 100% matched what we were seeing in the dashboards, as well as build-in capability to back-fill data in sequence in the event that the connection ever went down. An example of this was that, in the course of testing, we encountered several incident where the RS232 was switched off by mistake, affecting the continuous flow of data, so we were able to change its location so that it was not humanly reachable and disturbed.
Industrial data science.
The objective of exploratory data analysis was to observe trends in the data and compare them with what was happening on the factory floor, which included:
- Forecast time to fill a 1T bulk container, based on processing time
- Forecast cost of energy per machine, per day vs. throughput
- Create a new metric of cost of energy per kg of plastic
- Compare energy efficiency between different machines
- Identify waste and over filling causes
- Calculate giveaway in financial terms
What’s next?
After providing evidence of the amount of giveaway in dollar terms, which amounted to tens of thousands of dollars per week, and providing insights into how to reduce reduce energy costs by smarter machine utilisation, we are now applying the same solution to additional facilities with the aim to compare facility performance. This will, in turn, will provide additional data points and highlight further performance improvement opportunities across all sites.


