Pain-point 3:
Reporting is manual, out-of-date, or best guess.
Automate reporting + make it simple for anyone to deep-dive your data.
Whether it be because it's difficult to do or the output is inaccurate or incomplete, bad reporting delivers bad decision-making and leads to a lack of interest in what more data can tell you about your operations and how it can be used to improve what you do.
Our Rayven Platform can fix this for you, fast. Not only does it make it possible to pull all of your data from anywhere into one place to give you accurate, easy reports that are always up-to-date; but it also gives you the ability to create interactive dashboards and data visualizations for different users that update in real-time, automate reporting processes, explore data sets using Machine Learning and Conversational Analytics - and much more.
Related business
symptoms:
Reporting is a Time-Consuming Task for Specialists: Manual reporting processes are and frequently has errors. It requires significant human input from experts in data, rather than experts in the field for which the data is being used to improve.
Inaccurate Decision-Making: Decisions are being made on data that's old and/or has holes on it. This may be ok for strategic decision-making, but can be highly-detrimental to in-field operational decisions - especially when it comes to safety.
Lack of Real-Time Responsiveness: You can only react to situations that have already evolved or changed, rather than proactively managing them with up-to-date information. This lag can affect everything from production to inventory management, ultimately impacting competitiveness and growth.
Join the teams big + small already achieving more with Rayven:
How the Rayven Platform solves it.
The Rayven platform makes it simple to pull together data from any system, silo or in-field device to create dashboards; but it also excels at reporting - think of it as an easier-to-use, real-time BI platform with extreme interoperability + predictive analytics capabilities.
How we integrate different
data sources:
Hardware with TCP/IP Capabilities: Devices and machines equipped with TCP/IP can easily connect to the platform over the internet.
Gateways: IoT gateways can seamlessly integrate with our platform, aggregating data from multiple sources and sending it to the cloud for analysis.
Systems with APIs: The Rayven platform can connect with any system that offers an API, allowing for the exchange of data between different software and hardware devices.
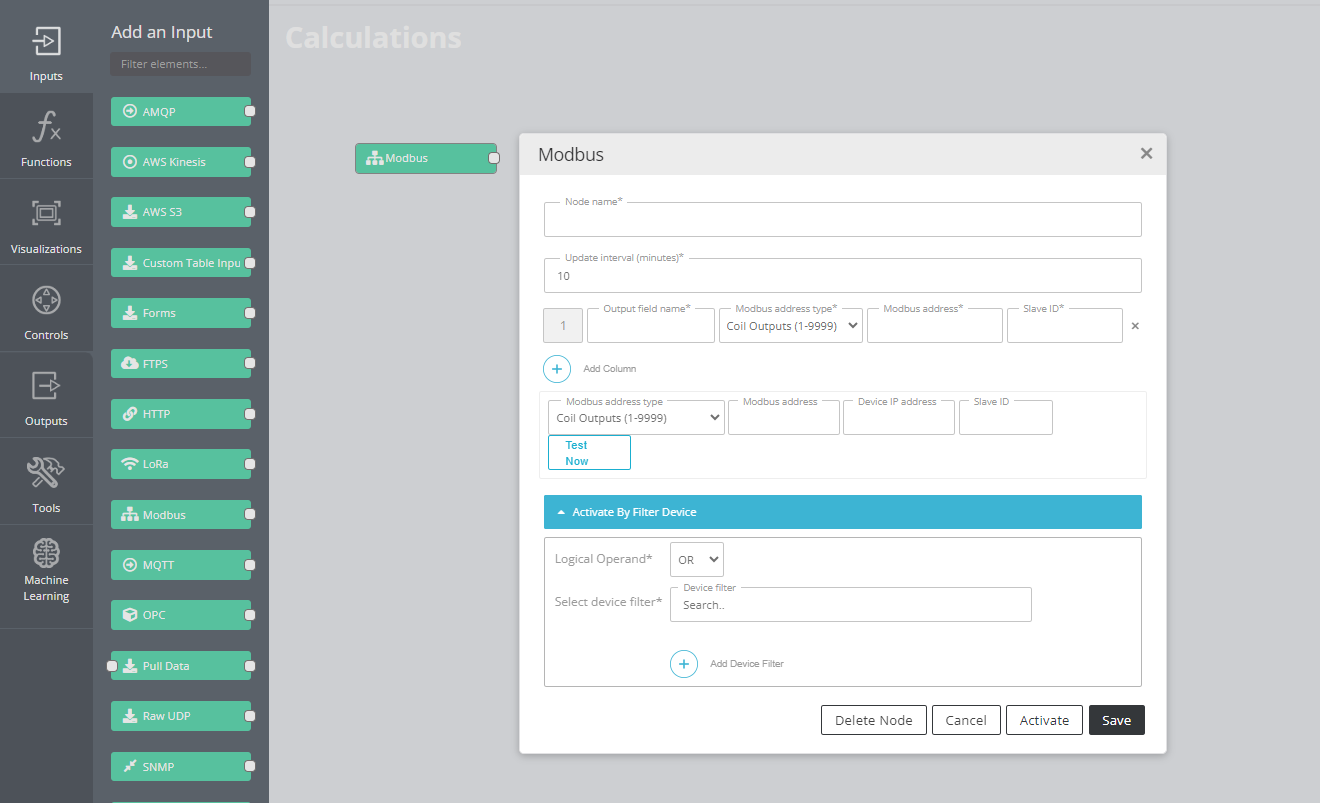
Support for Various Protocols + Standards: The platform supports a variety of communication protocols and standards beyond TCP/IP, such as MQTT, AMQP, Modbus, and SNMP. This broad support ensures compatibility with a wide range of devices and systems.
Cloud Integration: Integration with cloud services (like AWS S3 and AWS Kinesis) enables the Rayven platform to handle large-scale data storage and processing.
FTP Support: Where direct connectivity is not feasible, the platform accommodates data acquisition via FTP, allowing manual uploads of data files.
Custom Scripts: For systems that are locked or have unique comms needs, we allow you to develop and deploy custom scripts. This enables us to integrate Proprietary or Closed Systems, Legacy Systems, and those with complex integration requirements.
Create real-time dashboards with 40+ data visualizations:
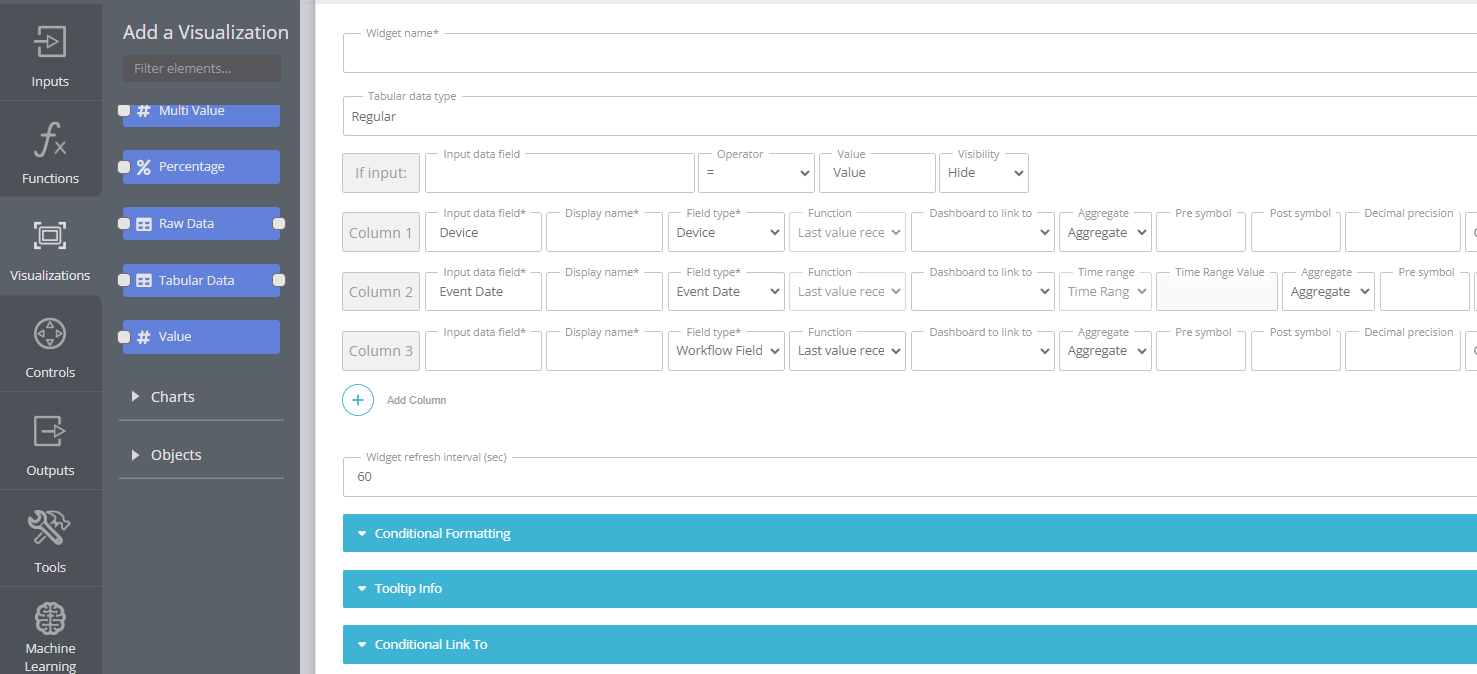
Pre-built and highly-customisable via an easy-to-use drag-and-drop interface, you can easily configure dashboards for those in the boardroom and in the field and make them available to individuals, groups or business-wide with simple user management.
Real-time alerts + reports, with complete accuracy - in one-click:
The reporting burden is very real for many businesses and Rayven makes it possible to create complete performance reports through a click of a button or via regularly scheduled reports.
- Schedule: select the date, time, and how you want reports sent
- Data: select the amount of data the report will contain
- Addresser: customise who the report comes from
- Recipients: select which users will receive the report
- Attachments: attach a CSV or TXT file that contains raw data
- Widgets: add images of your widgets to reports
- Email customisation: edit email sends.
The step-by-step.
Step 1: Data + Reporting Assessment
We work together to look at your current reports and reporting processes, as well as assess the data you have, where it is, refresh rate, and what new data you will need to evolve your reporting
From there, we'll identify data holes or comms/integration problems, before working with you directly to fill them or bringing in a partner who, alongside our experts, can support you with IoT devices and gateways to collect in-field data and get it to the Rayven platform.


Step 2: Connect
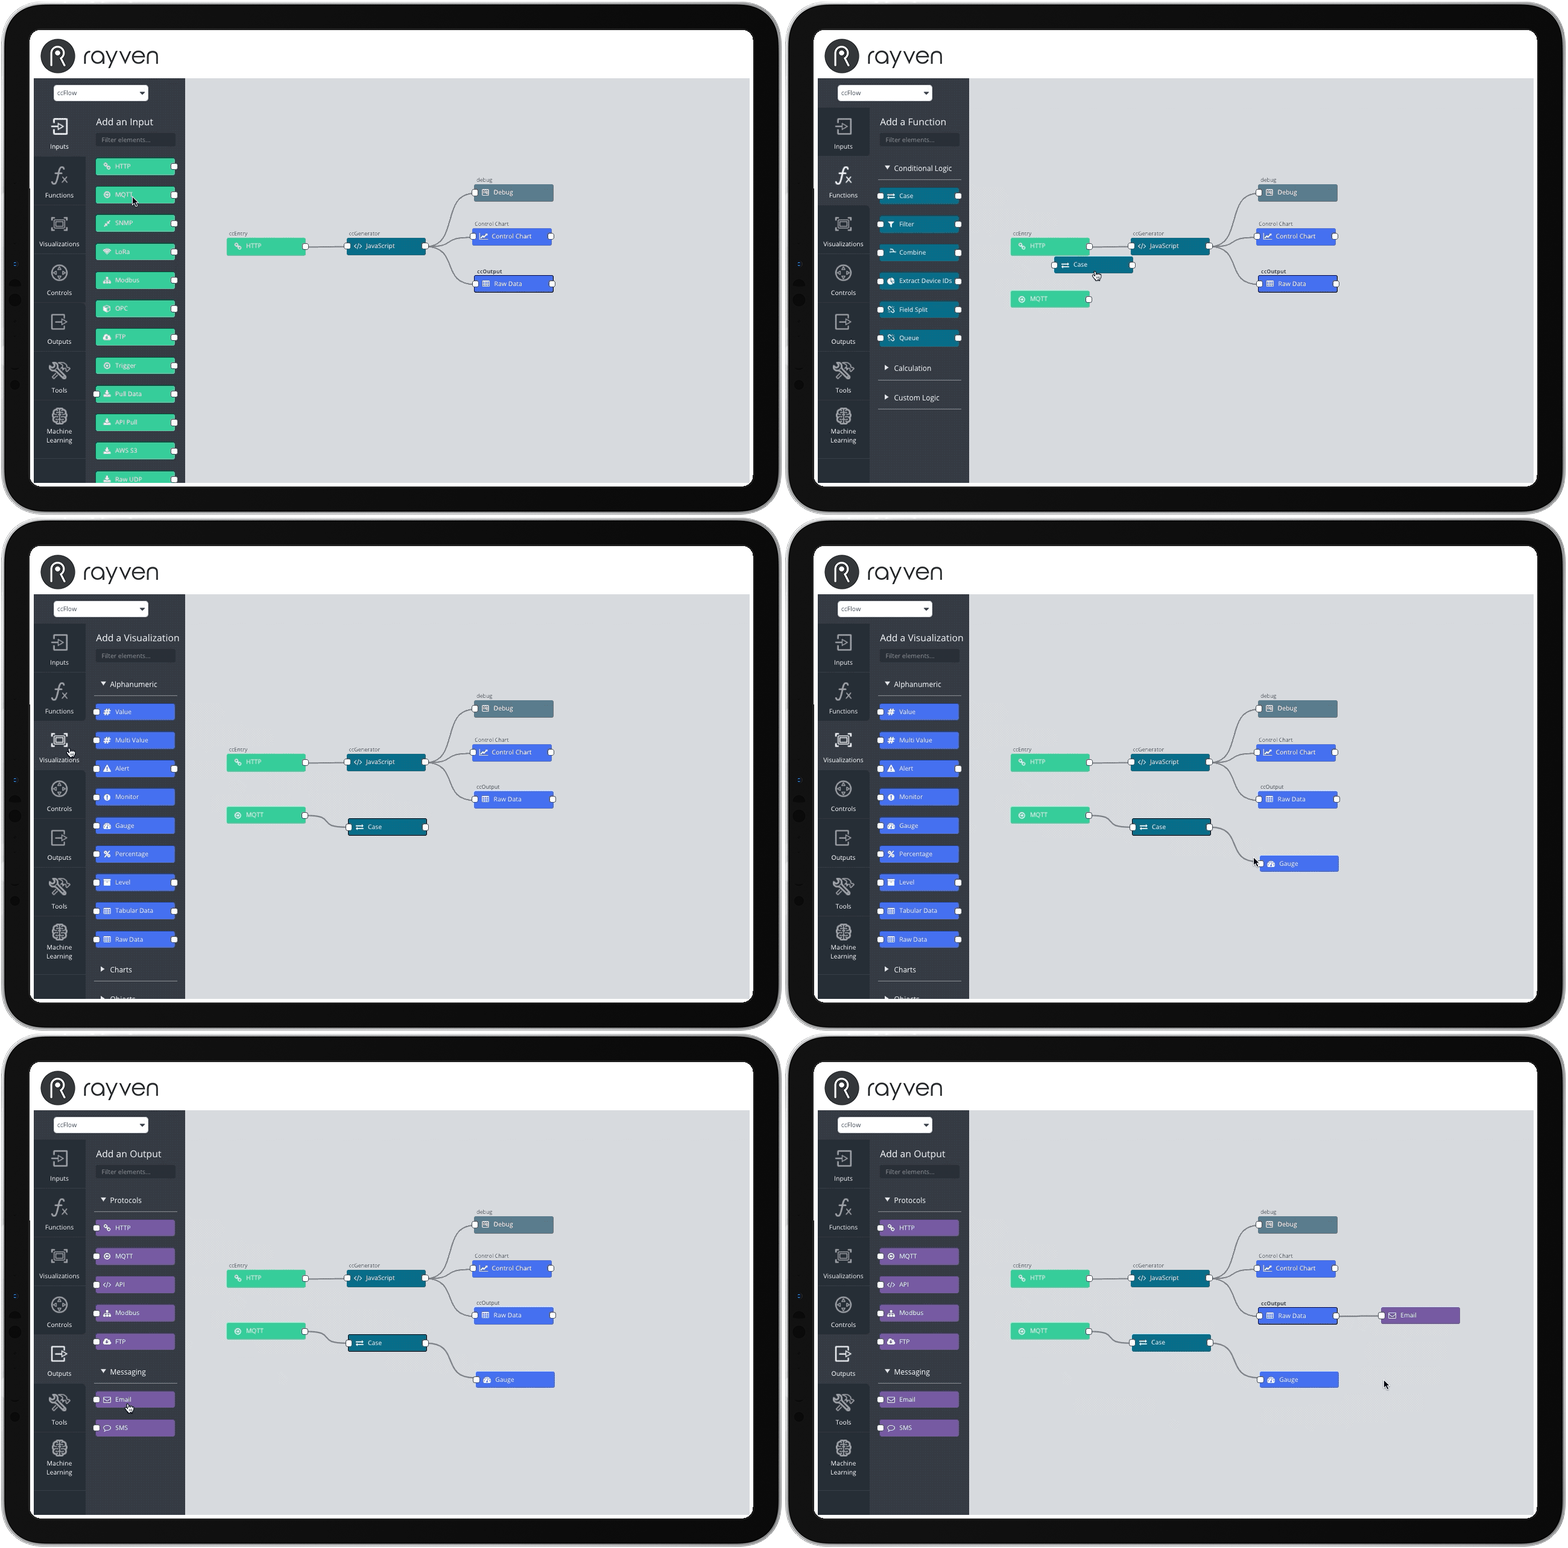
Our platform has out-of-the-box integrations with major platforms and 20+ universal connectors (nodes) that work at the protocol-level + are easy to configure, enabling you to connect any data feed and system.
Our platform's approach enables bidirectional data flow in the native protocol of each connected device in various formats, including JSON, XML, CSV, plain text, and more.
Step 3: Process, Normalise, Store + Access
Following ingestion, data undergoes processing which includes validation, normalisation, and potentially transformation, aligning it with a standardised format for analysis and storage.
The processed data is then stored in scalable and secure databases or data lakes, which is adaptable for cloud or on-premises setups.


Step 4: Build Dashboards, Reports + Alerts
You can build custom, interactive dashboards for different users, giving them access to the platform's tools and data visualizations through any device, and enabling them to drilldown into data sets and sources, anywhere.
Equipped for complex data analytics, the platform enables functionalities like Big Data analysis using Machine Learning, predictive analytics, and Digital Twin modelling all through our dashboards
You can also create standard, scheduled pdf reports that are automatically created and sent to selected users that display the data that you need.
Data Visualizations + Widgets available in Rayven include:
Alphanumeric widgets available:
- Value: alphanumeric value display
- Multi-value: multiple alphanumeric values displayed in one widget
- Alert: conditional display of alphanumeric
message and coloured background - Monitor: alphanumeric value display with range-dependant colour coding
- Gauge: gauge display with range-dependant colour coding
- Percentage: bar or column display with range-dependant colour coding
- Level: display a tank icon with actual and percent fill with range-dependant colour coding
- Tabular data: tabular display of multiple fields showing most recent instances only
- Raw data: tabular display of multiple fields showing full history.
Charts widgets available:
- Pie: showing proportions by device or by field
- Line: time series line chart with or without comparison and target lines
- Bar: time series bar chart with or without comparison and target lines
- Pareto: configurable for frequency or sum of events
- Cartesian: dot plot with configurable quadrants
- Multi-axis: showing multiple variables as lines and or columns
- Forecasting: line chart with forecasting models and projected results
- Control: I-MR control chart with Nelson Rules
- Polar: display the distribution of vector over a period of time
- Category bar: configure and display data using fixed categories on the x-axis.
Object widgets available:
- Map: with configurable highlighting, geofencing, tracking, proximity and drill down
- Images: display a static image
- Live video stream: display a live video stream.


