<img height="1" width="1" style="display:none;" alt="" src="https://px.ads.linkedin.com/collect/?pid=2581828&amp;fmt=gif">

Interfaces, Alerts + Reporting.

Build the frontend interfaces users need to explore, analyse + action in real-time.

Rayven makes it easy to create the interfaces users need to explore real-time data, leverage predictive + conversational analytics, uncover optimisations, and make operational changes in the moment.

Deliver real-time transparency + all-new capabilities.

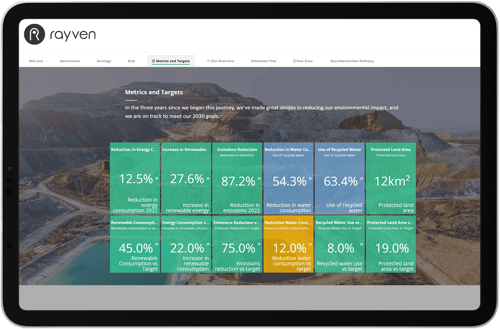
The Rayven Platform makes it easy for you to create the dashboards, prompts, insights, alerts, virtual controls, custom GPTs, reports, data visualizations - and more - that your end-users need to make + action better decisions, faster.

Full of ready-to-deploy widgets + out-of-the-box reports that make it ultra-simple to design what you need; Rayven gives frontend-users all-new capabilities that they can access anywhere, on any device.

40+ ready-to-deploy data visualizations + widgets
Simple drag-and-drop configuration
Build interactive, mobile-optimised dashboards users can explore
Create thresholds + trigger multi-channel alerts
Offer real-time, predictive + conversational analytics
Get accurate, 1-click reporting on anything

Create the data interfaces, alerts + reports your users need, simply.

Water-1-Dashboard
EYEMine-SBK-Screenshot-smaller
Rayven-ESGLive-5-Metrics
MyEnergy-Plus-Tablet-2a
PLF-Local-Weather
GenAI-Screenshot-Jun-24

Enable your users to explore your real-time data in new ways, give them predictive insights + guidance, and allow them to take action in the moment.

It's easy to do all the hard work of the technical backend development and deployment of an application that has incredible functionality, but without an easy-to-understand and use frontend user interface (UI), it simply won't get used or achieve what you set out to do.

Rayven doesn't compromise frontend UX for technical capability, giving you all the tools you need to create brilliant UIs full of functionality, data visualizations + features.

Custom Dashboards + Data Visualizations.

Data visualizations have the capability to simplify complex facts and figures, transforming raw data into actionable business insights, so Rayven makes it easy to create different dashboards for individual user types based on your goals and needs.

Because of the Rayven Platform's complete interoperability + integration capabilities, we can give your users access to all your data in real-time, providing an interactive single pane with both the micro and macro view that they drill-down into and explore.

With 40+ ready-to-deploy widgets + a drag-and-drop configuration interface, our platform makes it really simple to build highly-customisable dashboards for those in the boardroom and in the field that put BI tools to shame.

Water-1-Dashboard

(Just some) of our platform's data visualization widgets include:

  • Value: alphanumeric value display
  • Multi-value: multiple alphanumeric values displayed in one widget
  • Alert: conditional display of alphanumeric
    message and coloured background
  • Monitor: alphanumeric value display with range-dependant colour coding
  • Gauge: gauge display with range-dependant colour coding
  • Percentage: bar or column display with range-dependant colour coding
  • Level: display a tank icon with actual and percent fill with range-dependant colour coding
  • Tabular data: tabular display of multiple fields
  • Raw data: tabular display of multiple fields showing full history
  • Pie: showing proportions by device or by field
  • Line: time series line chart with or without comparison and target lines
  • Bar: time series bar chart with or without comparison and target lines
  • Pareto: configurable for frequency or sum of events
  • Cartesian: dot plot with configurable quadrants
  • Multi-axis: showing multiple variables as lines and or columns
  • Forecasting: line chart with forecasting models and projected results
  • Control: I-MR control chart with Nelson Rules
  • Polar: display the distribution of vector over a period of time
  • Category bar: configure and display data using fixed categories on the x-axis
  • Map: with configurable highlighting, geofencing, tracking, proximity and drill down
  • Overlay Map: put on top of maps custom data.
  • Sound: monitor readings in real-time
  • Images: display a static image
  • Live video stream: display a live video stream

Create + trigger real-time alerts, simply.

Using our platform's Workflow Builder you can easily create rules, set thresholds, and trigger alerts based on real-time performance and the predictive analytics being generated through the use of Machine Learning.

Put in place simple conational logic, dynamic process adjustments + create cross-device workflows to trigger multi-channel alerts via dashboards, SMS, email, or audibly (alarms etc.)

Rayven's alert functionality enables you to keep operators safe, alert them to machinery that needs attention, flag optimisations - the only limit is what's connected.

F1-5-SCADA
Collective-Intelligence-Solution-Forklift-Tracking

Report - with complete accuracy - in one-click.

The reporting burden is very real for many industrial businesses; from compliance and ESG, to the key everyday metrics and long-term business performance measures, simply keeping track of outcomes is labour-intensive.

Rayven makes it possible to create complete performance reports at-will via a click of a button or via regularly scheduled reports distributed through email.

Our platform, and the applications built on it, can decimate the reporting burden and make proving compliance simple.

Virtual Controls + Third-Party (Bidirectional) Feeds.

Rayven enables you to create virtual controls and add them to your interfaces so that operators can take action based on forecasts, real-time data, or new insights.

Because of Rayven's extreme interoperability and data transformation capabilities, we can also push real-time data to any machinery, plant, and system. This could be to simply display accurate, collated + analysed data in external dashboard; or it could be instructions that direct the assets to do something/anything.

Rayven gives legacy equipment a new lease of life and offers you the opportunity to automate whole new areas of your operations, simply.

Learn more about Rayven's Control + Automation capabilities  

Rayven-ESGLive-5-Metrics
GenAI-Screenshot-Jun-24

Conversational Analytics: ask questions, get insights + much more.

The Rayven Platform enables you to put a Generative AI interface on your dashboards, enabling people using your custom applications (and with the right permissions) to interrogate data, uncover new insights + put in place backend processes that improve operations, simply.

Use Rayven to interrogate your real-time data as it's being created, train the LLMs to give it context, add historical data sets, and help it to understand your business and its individual characteristics.

This transformative technology gives users all-new capabilities to improve, simply. Ask what's happening, how to improve performance, what machinery needs servicing (and more); then ask it to make the changes for you - the only limit is your imagination!

Learn more about Rayven's Generative AI capabilities  

Need a custom data visualization? If you need to visualize data in unique ways, talk to us. 

Our team will work closely with you to understand your needs + goals, and we will provide you with what you need.

Regardless of your challenge, our expert team can create and deploy a bespoke solution tailored to your business in weeks to deliver an even bigger ROI, faster.

Workflow-Builder-move-450

Create unique interfaces for different users.

Trigger alerts + report on anything.

Give predictive + conversational insights to explore data.

Add controls + the ability to affect change.

Every feature you need + others you’ll want in one platform.

Easy-to-use, fast-to-deploy + delivering extreme capabilities; the Rayven Platform gives you everything you need to build brilliant applications, simply.

Q1-24-New-Short-Stack-Vertical
interoperable-grey

Solve complex integration challenges, fast.

Explore Integrations + Data Ingestion 

data-stream-grey

Manage all your data - in any format, anywhere - simply.

Explore Data Management  

Monitoring-grey

ETL + analyse all your data in real-time time.

Explore Data Transformation + Analysis  

Easy-to-use-grey-1

Build Data Visualizations + Dashboards, simply.

Explore Data Visualizations 

Easy-to-use-grey-1

Build workflows that optimise processes.

Explore Workflow Builder  

predictive-models-Grey

Machine Learning + predictive analytics.

Explore Machine Learning + Predictive Analytics  

Future-grey

Unleash the power of Generative AI everywhere.

Explore Generative AI 

All-in-one-grey

Build automations + virtual controls to optimise operations.

Explore Control + Automation 

cloud-grey

Deploy anywhere + improve existing stack.

Explore Deployment + Architecture 

Monitoring-grey

Update + manage devices at-scale, simply.

Explore Device Management   

white-label-Grey

Deliver a seamless UI + UX that carries your brand.

Explore White Labelling + Productisation  

employee-grey

Manage user access, control + roles, effortlessly.

Explore User
Management 

data-security-grey

Sleep easy with enterprise security built-in.

Explore
Enterprise Security 

Dashboard-Grey

Build Interfaces, visualizations + alerts for anyone.

Explore Interfaces, Alerts + Reports  

pixel

 Want us to train + support your team?

Rayven offers a range of services + training options to get you started, faster, alongside 24/7 support.

Find out more.

What do you want to do next?

Team

Get free advice from one of our experts: tell us more so the right person can reach out + help you faster.

Or you can: