


Trusted by 240+ teams across Australia + globally


Watch: Explore some of Rayven’s partners’ stories.
Rayven delivers real-world results for partners and their customers around the world - discover some of their stories.
Why we're faster, better + lower cost.
Don't start from scratch: we balance customisability + capability with speed and long-term support.
Ready-to-go
from the start.
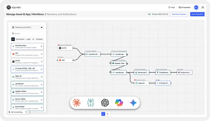
The Fragmented Enterprise Stack.
/Website%202026/Partner%20+%20Tech%20Logos/Integration-mulesoft.webp) Integration
Integration/Website%202026/Partner%20+%20Tech%20Logos/storage-snowflake.webp) Storage
Storage/Website%202026/Partner%20+%20Tech%20Logos/Streaming-Confluent.webp) Streaming
Streaming/Website%202026/Partner%20+%20Tech%20Logos/workflow-zapier.webp) Workflow
Workflow/Website%202026/Other%20Pages/Bubble-alt.png) App Dev
App Dev/Website%202026/Partner%20+%20Tech%20Logos/Data-Lake-Databricks.webp) Data Lake
Data Lake/Website%202026/Partner%20+%20Tech%20Logos/Visualization-PowerBI.webp) Visualization
Visualization/Website%202026/Partner%20+%20Tech%20Logos/IoT-ML-AWS.webp) IoT / ML
IoT / ML/Website%202026/Partner%20+%20Tech%20Logos/Security-Crowdstrike.webp) Security
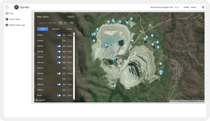
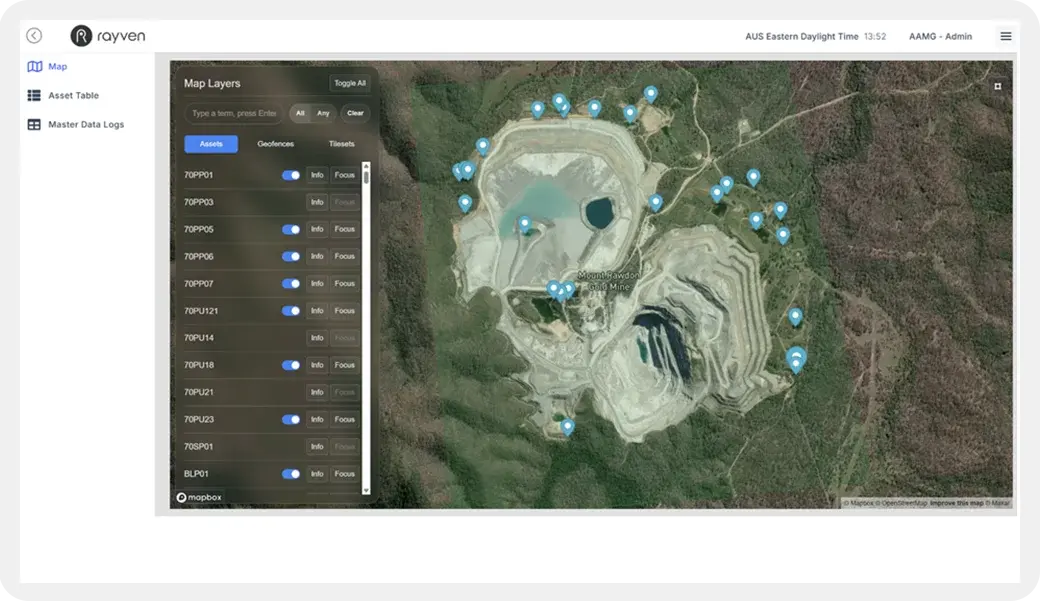
SecurityOne platform with the capabilities of multiple technologies - united, ready + managed for you.
Customised for you.
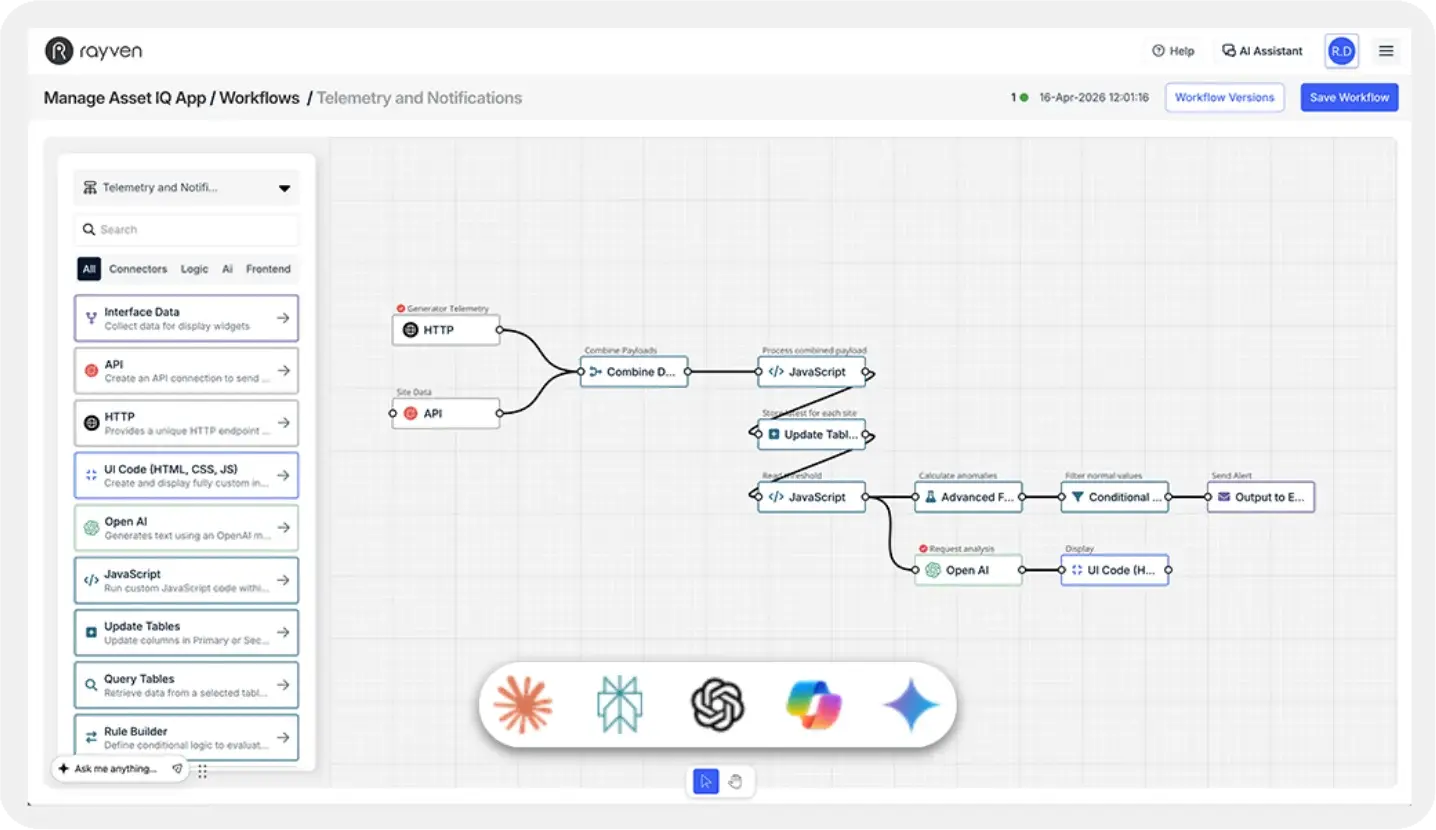
Built for your needs - no bloat, no consultants, no lock-in.
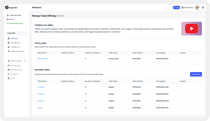
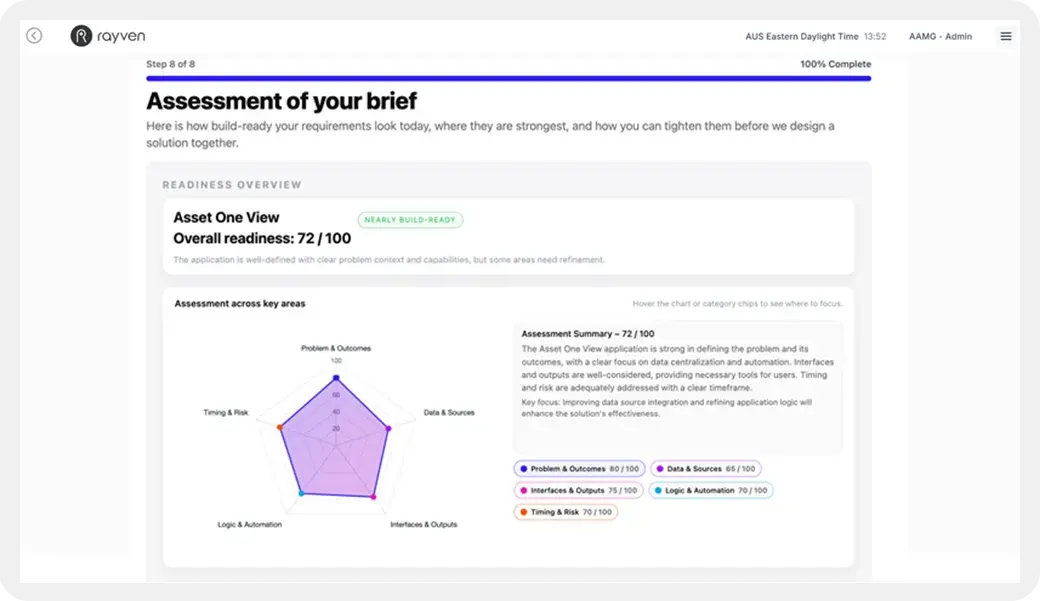
/Website%202026/Content%202026/001%20-%20Readiness%20Tool/App-Readiness-Tool.webp?width=540&height=317&name=App-Readiness-Tool.webp "App-Readiness-Tool")
Why Rayven costs less than enterprise solutions.
Businesses of all shapes and sizes need powerful systems, but not the cost and chaos that come with traditional enterprise software.
Rayven delivers the same outcomes as multiple, expensive enterprise technologies, but with a radically lighter footprint + much, much faster.
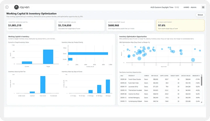
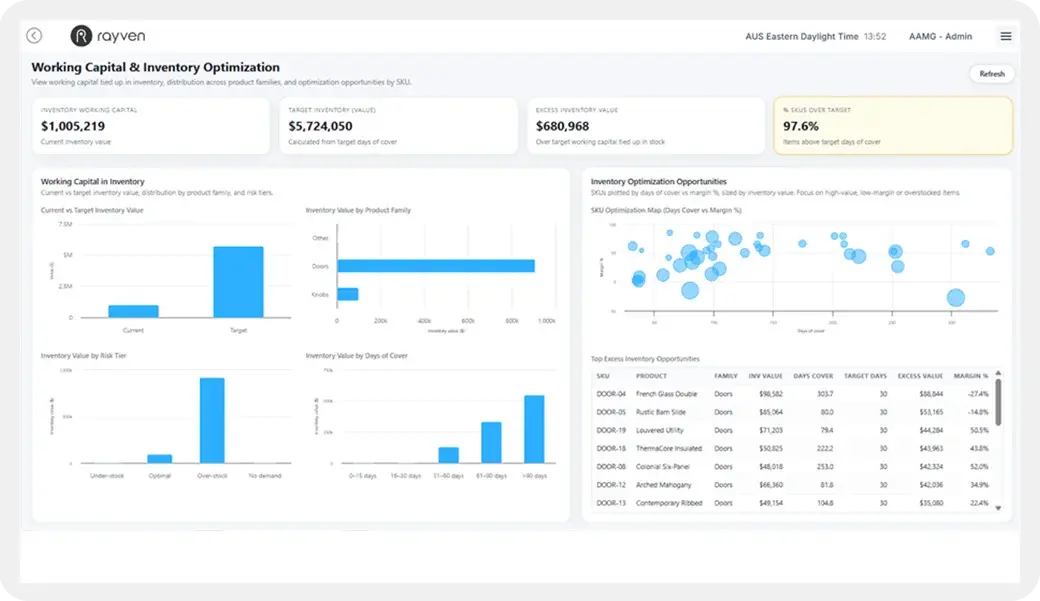
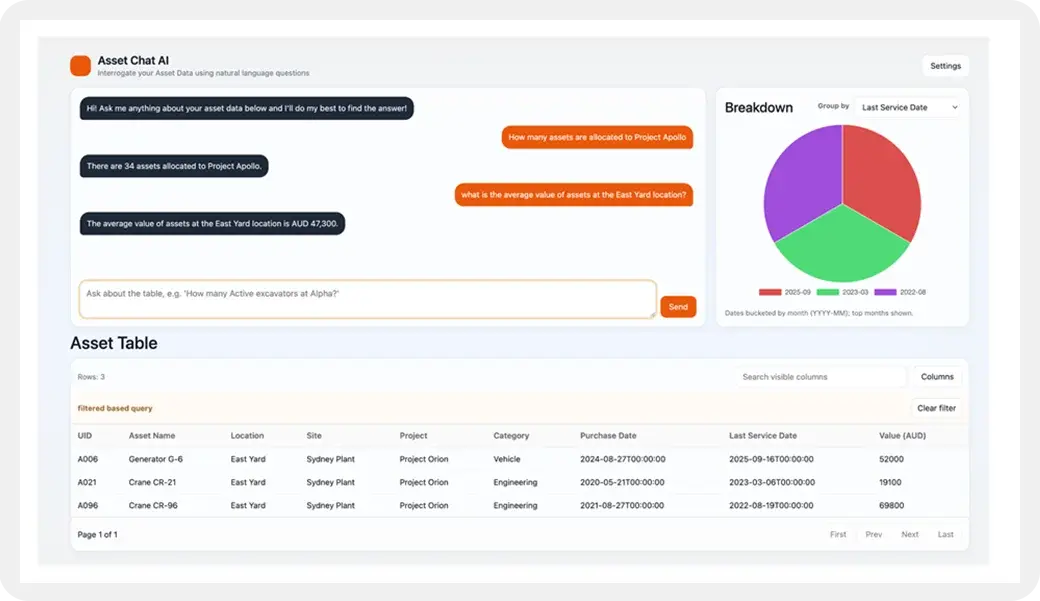
Everything you need in one platform.
Integration, storage, data processing, automation, AI + apps: one platform.
We own, build + run our own technology.
No resellers or third-party mark-ups; new capabilities are aligned to you.
Delivered for you by our specialists.
We design, build, deploy + support - no need for developers or consultants.
Start small then scale, infinitely.
Start small, expand across sites + teams without engineering or lock-in.
Rayven is loved by IT, Digital, Ops... everyone.
Rated 5/5 based on over 140 reviews across SourceForge, Capterra, GetApp, Software World, DEVPOST, and G2.
‘Easy IoT solutions.’


‘A practical solution
for connecting our
machinery and data.’ Etiko, CEO, Machinery
‘Fast, reliable, and
developer-friendly.’Chloe, IT

‘Allows us to deliver
a remarkable number
of different energy
and IoT solutions.’ Gavin, CEO

‘A more user-friendly
alternative, eliminating
the heavy setups.’
‘A versatile low-code
platform that
really delivers.’Marof, Outsourcing
‘The best balance
of no-code simplicity
and dev flexibility.’Alexander, Developer
‘Switch to code when
needed is incredibly
useful.’
‘A true all-in-one
platform for
IT Teams.’ Margarita, IT Consultant
‘Rayven helps us
move from idea
to execution fast.’James, Mechanist
‘We see Rayven as
a key part of our
digital transformation.’ Rob, CEO

‘Incredible for
monitoring our critical
medical storage.’Tami, Pharmaceuticals
‘Fast automation, great
for fraud and
risk management.’Frank, Risk Manager, Insurance

‘A powerful all-in-one
platform for building apps
and automations.’
‘Powerful adaptive
analytics &
predictive maintenance.’
‘Rayven services
the divide between
product and IT!’ Jeffrey, Product Supervisor, Wholesale
‘Scalable low-code
platform that saves
dev teams time.’Prafull, Developer
‘The platform’s flexibility
means we can address
a broad range of use cases.’Digital Manager

‘Powerful IoT + AI platform
that simplifies complex
data management.’Adam, Risk Manager, IT