


Platform > Security, Governance + Hosting Layer > Usage + Metrics
Usage + metrics.
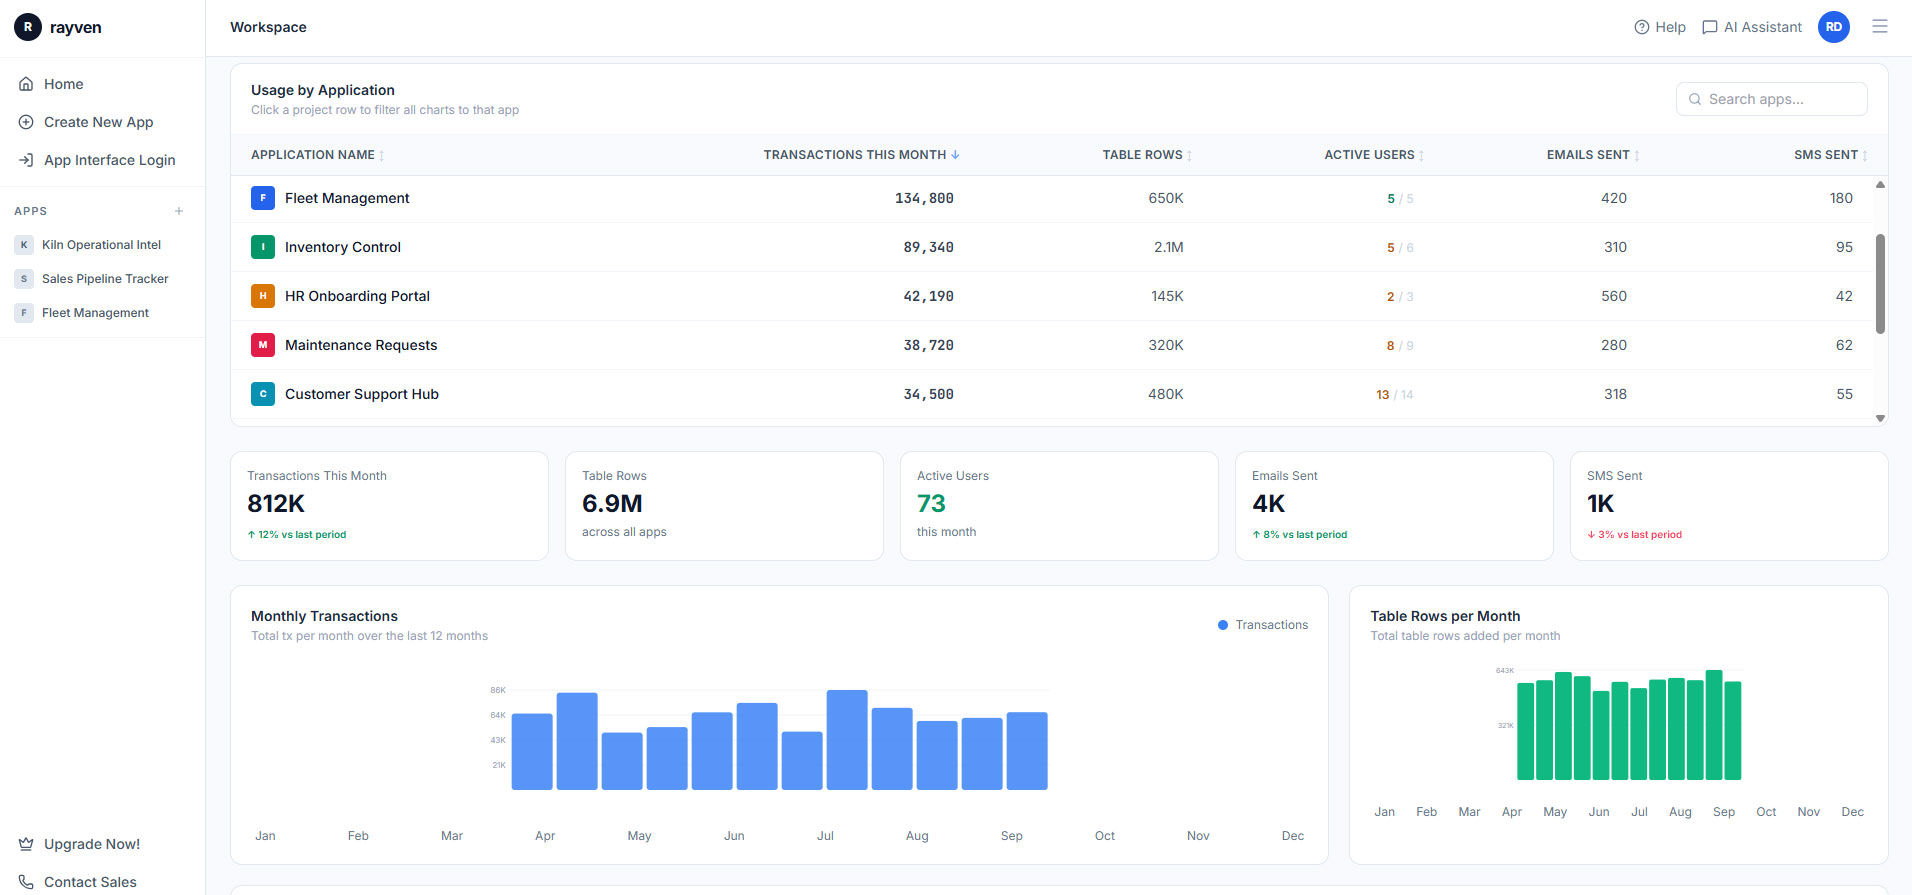
Monitor platform health, data volumes + workflow performance in real-time - built-in observability across every layer, no additional monitoring tools required.


CAPABILITY OVERVIEW
Full platform observability, out of the box.
Rayven's usage + metrics capability provides built-in observability across every layer of the platform - workflow execution performance, data ingestion volumes, user activity, API endpoint health + resource consumption.
All metrics are available in real-time via built-in monitoring dashboards and historically via logs + exports. No additional monitoring infrastructure is required. Admins see what's happening across the platform the moment it happens - and receive alerts when performance conditions warrant attention.
Visibility provided across:
-
Real-time workflow execution rates, success rates + error frequencies
-
Data ingestion volumes per integration source
-
User login events + session activity
-
Dashboard + application usage patterns
-
API endpoint call volumes + response latency
-
Resource consumption across compute + storage
KEY CAPABILITIES
What Usage + Metrics gives you.
Workflow execution monitoring
Monitor all workflow executions in real-time - run counts, success rates, failure rates + latency per workflow. Identify high-frequency workflows, detect execution errors + track performance trends over time. Metrics update live as workflows execute across the platform.
Data ingestion + volume monitoring
Track data volumes flowing through each integration source, workflow node + storage layer. Monitor ingestion rates, peak volumes + storage consumption per dataset. Identify sources with unexpected gaps or volume anomalies before they impact downstream processing.
User activity monitoring
Track user login events, session activity + feature usage across the platform. Understand which users are active, which capabilities they're using + when platform activity peaks. User activity data feeds access governance + compliance reporting requirements.
API endpoint performance monitoring
Monitor call volumes, response latencies + error rates across all exposed API endpoints. Track external system consumption + identify endpoints with high load or degraded performance. Data informs capacity planning + SLA management with consuming systems.
Resource consumption dashboards
Real-time visibility of compute resource usage, database storage consumption + bandwidth utilisation. Proactive capacity monitoring enables scaling before resource constraints impact performance. Historical consumption data supports cost management + infrastructure planning.
Threshold-based alerting on metrics
Configure alerts on any usage metric - error rate spikes, storage approaching capacity, API latency degradation + workflow volume anomalies. Alerts fire via email, SMS or webhook when configured thresholds are crossed, enabling proactive response to platform health events.
HOW IT CONNECTS: EXPLAINER
Where Usage + Metrics fit in the Rayven Platform stack.
Usage + Metrics provides observability across every other layer of the platform.
-
Integration Layer: monitor ingestion volumes, connector health + API endpoint performance.
-
Data Layer: track storage consumption, query performance + database resource usage.
-
Execution Layer: monitor workflow execution rates, latency + error frequencies in real-time.
-
Presentation Layer: track dashboard usage, user activity + interface performance. A
ll metrics are available in real-time via monitoring dashboards and historically via logs + exports.
USE CASES
How Usage + Metrics gets used.
Operations team monitoring platform health in real-time
A platform administrator monitors a real-time dashboard showing workflow execution rates, error frequencies + data ingestion volumes across all integrations. When error rates spike on a specific workflow, an alert fires immediately. The admin uses the Inspect Data tab to identify the root cause within minutes - without waiting for a user to report a problem.

Compliance team producing monthly usage reports for a regulated client
A financial services firm's compliance team runs monthly usage reports covering user access activity, data processing volumes + API endpoint consumption. Reports are generated from platform logs + exported for inclusion in the firm's compliance evidence pack. Data is immutable + timestamped.

Partner managing resource allocation across multiple clients
An MSP monitors per-client resource consumption across a shared infrastructure deployment. Usage metrics per Label show which clients are generating the highest volumes. The MSP uses consumption data to inform capacity planning, client billing + infrastructure scaling decisions.

Rayven Usage + Metrics FAQs:
What usage metrics does Rayven provide?
Rayven tracks user activity, workflow execution counts, API call volumes, data ingestion rates, dashboard view counts, and storage utilisation. Metrics are available in the admin interface and exportable for external reporting. See the Security Layer.
Can administrators see which users are most active?
Yes. User-level activity metrics show login frequency, feature usage, dashboard views, and form submissions. This is useful for licence management, adoption tracking, and identifying training needs. See Users, Roles + Access.
Are workflow execution counts tracked?
Yes. Each workflow records execution count, success rate, average duration, and failure events. This data helps identify high-frequency automations for optimisation and capacity planning. See Workflows + Triggers.
Can usage data be used for licence management?
Yes. User-level and feature-level usage reports give administrators the data needed to manage seat counts, identify inactive licences, and right-size the deployment for contract renewals. See Security Layer.
Are API call counts visible per integration?
Yes. The usage metrics interface shows API call volumes broken down by endpoint and integration. This is useful for rate limit management and attributing platform load to specific integrations. See API Endpoints.
Can usage trends be exported for internal reporting?
Yes. Usage reports can be exported as CSV files or delivered on a schedule. This supports internal IT chargebacks, executive dashboards, and contract renewal reviews. See Dynamic Reports.
Does Rayven alert administrators when usage thresholds are approaching?
Yes. Configurable threshold alerts notify administrators when storage, API call counts, or user activity approach defined limits. This prevents unexpected overages and supports proactive capacity management. See Notifications + Alerts.
Can data volume metrics be tracked per table or stream?
Yes. Storage metrics are broken down by data table and stream, so administrators can identify which datasets are growing fastest and plan archival or retention actions accordingly. See Data Management.
Are dashboard and report view counts tracked?
Yes. Rayven records view counts and unique viewer statistics for dashboards and reports. This helps identify which visualisations are most valuable to operational users. See Dashboards + Visualisations.
How long is usage metric history retained?
Usage metric history retention is configurable per deployment. Managed cloud deployments retain rolling metrics for a defined period by default, with options for longer retention to support annual trend analysis. See Hosting + Management.
Also in Security, Governance + Hosting:
White Labelling
Custom domain, branding, colour palette + multi-tenant configuration for client-facing applications.
Deployment + Architecture
SaaS, private cloud, on-premise + Edge deployment options with identical functionality across all models.
Users, Roles + Access
Role-based access control, SSO, MFA + workspace-level permission management across all users.
Hosting + Management
Managed cloud hosting on AWS + Azure, SLA-backed uptime, automated backups + disaster recovery across all deployment types.
Enterprise Security
Encryption at rest + in transit, network segmentation, secrets management + compliance-ready governance.
Governance + Controls
Data retention policies, deployment controls, rate limits + environment isolation across the platform.
Audit Trails + Logs
Complete, immutable records of every user action, data change + workflow execution across the platform.
Want to discuss your hosting requirements?
Tell us where your data needs to live and we will walk you through the right deployment option for your environment.
Join the Shift
Discover the easy way to do something new.
Book a free 30 minute assessment with our team and we'll scope your project, needs + what a solution might look like.